Reporting and payouts
See what you're earning, which placements earn it, and when you get paid.
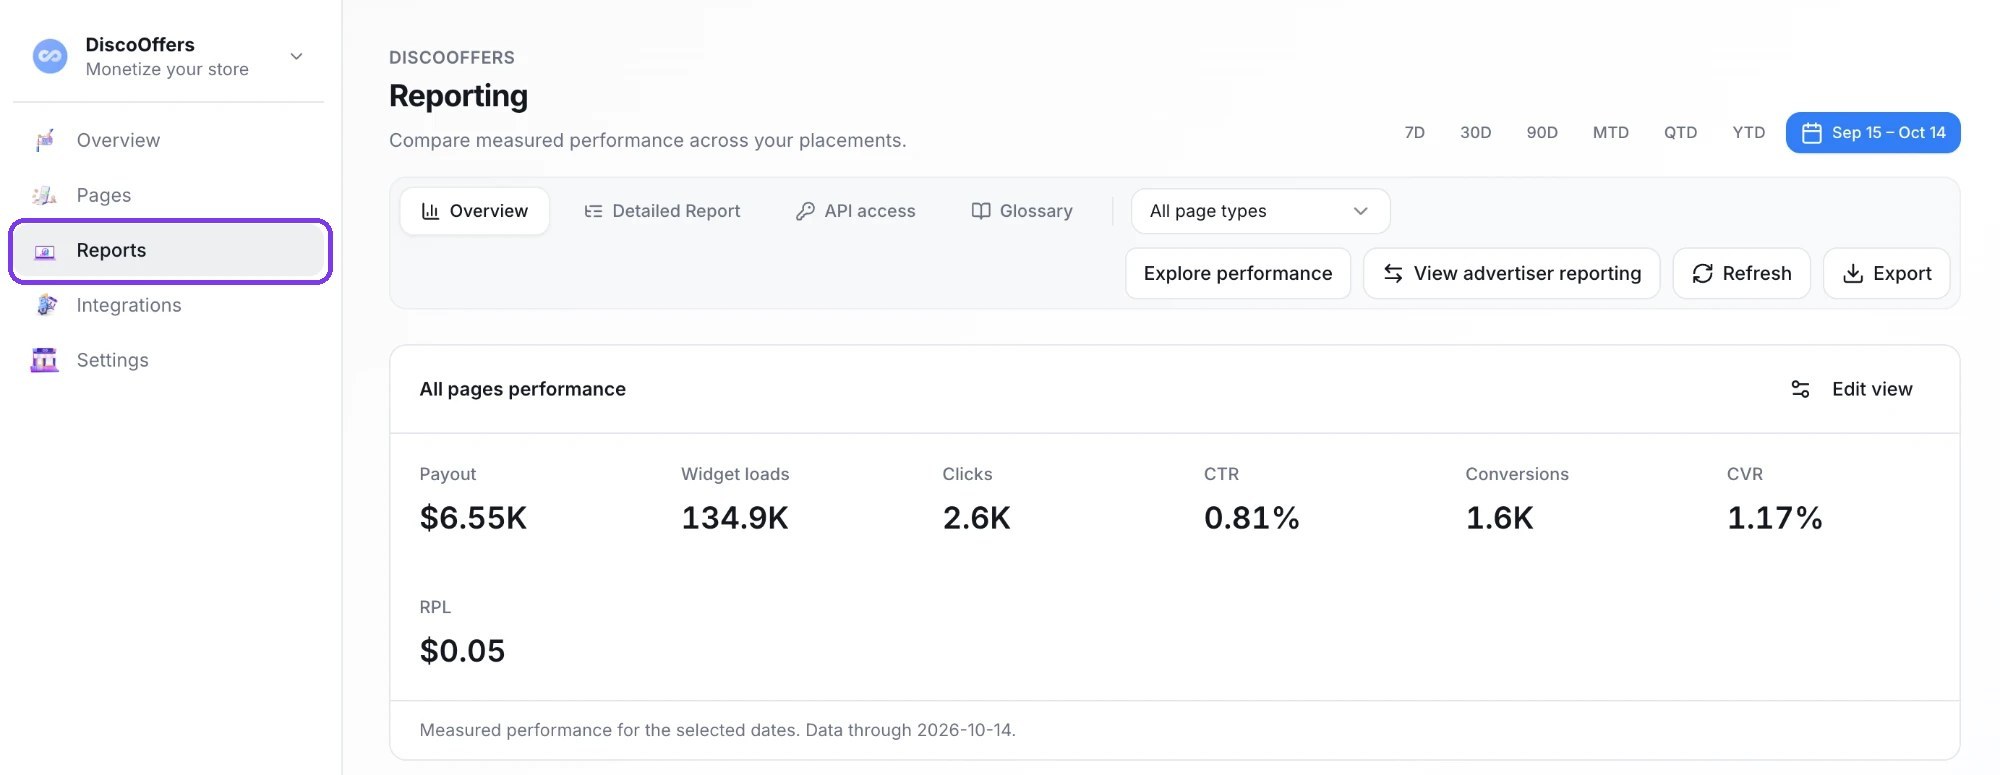
Find your reporting
Select Reports in the left-hand nav. You'll see four tabs:
- Overview: your headline numbers and how they're trending.
- Detailed Report: a table you can break down, filter and export.
- API access: keys for pulling your data into your own dashboards.
- Glossary: every metric defined, right in the platform.
All reporting is in UTC. Each view shows a Data through date so you know how current the numbers are.
Also running DiscoAds campaigns? Select View advertiser reporting to switch sides.
Overview
Start here for a quick read on how you're earning. The Overview shows Payout, Widget loads, Clicks, CTR, Conversions, CVR and RPL for the dates you pick.
- Dates: choose 7D, 30D, 90D, MTD, QTD, YTD, or a custom range.
- Page type: filter to one placement (Thank You, Order Tracking, Email offer wall, or Checkout for Pre-Purchase), or keep All page types.
- Edit view: choose which metric tiles show. Your choice is saved for each page type.
- Chart: switch between Daily and Monthly, click a metric to chart it, or use Add metric to compare two metrics on the same chart.
- Export: download the chart data as a CSV.
- Refresh: reload the latest data.
Today's numbers are still coming in, so the chart shows Today so far as a separate point, apart from the completed trend.
Explore performance
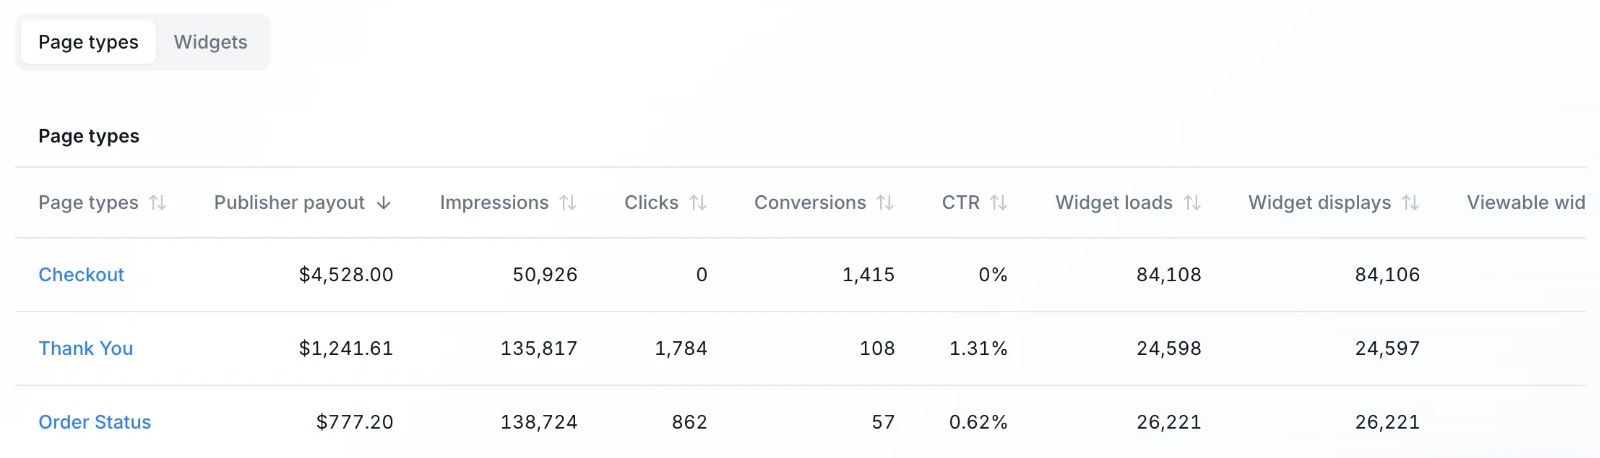
Want to know which placement earns the most? Select Explore performance. The Page types table lines up each placement (for example Thank You, Order Status and, if you use it, Checkout for Pre-Purchase) with payout, impressions, clicks, conversions, CTR, widget loads and widget displays for each. Switch to Widgets to compare individual widgets.
Pre-Purchase
This section applies only if you've added Pre-Purchase, the cash-back offer that appears inside your Shopify checkout. To see its numbers, choose Checkout in the page-type filter.
Pre-Purchase reports a little differently from your other placements. The tiles change to Payout, Unique purchases shown offer, Attributed conversions and RPL, and the chart adds two purchase rates: one for purchases where the offer was shown and one for purchases where no offer was recorded.
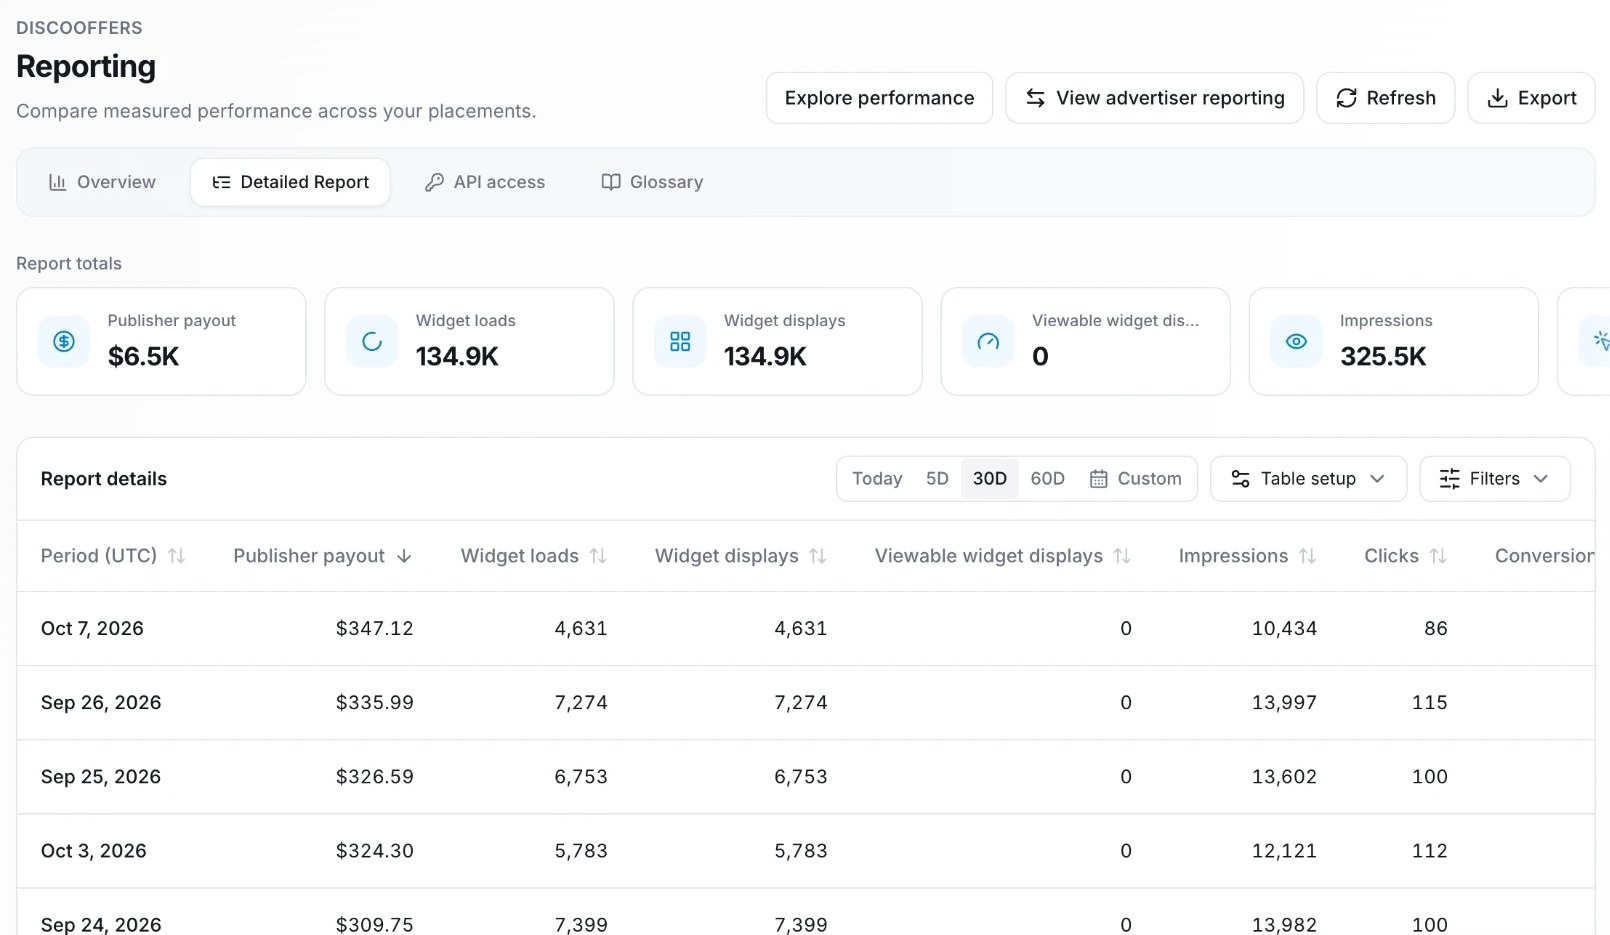
Detailed Report
Need more than the headline numbers? Build the exact table you want.
- Report totals across the top sum up every metric in your table.
- Dates: Today, 5D, 30D, 60D or Custom. Custom covers any range within your reporting history.
- Table setup:
- Row interval: Total, Daily, Weekly, Monthly or Hourly. Hourly covers short date ranges only.
- Breakdown columns: split rows by page type, widget type or widget ID, up to three at once.
- Metric columns: choose which metrics appear.
- Filters: limit the report to specific page types or widget types. Filters narrow the numbers; they don't add columns.
- Export: download everything that matches your setup as a CSV, not just the page you're viewing.
API access
Pull your reporting straight into your own dashboards or data warehouse. Create a key on the API access tab:
- Select Create key, name it, and copy the key when it's shown.
- Send the key in the
X-API-Keyheader of each request. The key is tied to your publisher account, so you don't need to pass an ID. - Keep the key secret. Use it from server-side code only, never in browser code. You can rotate or revoke a key at any time.
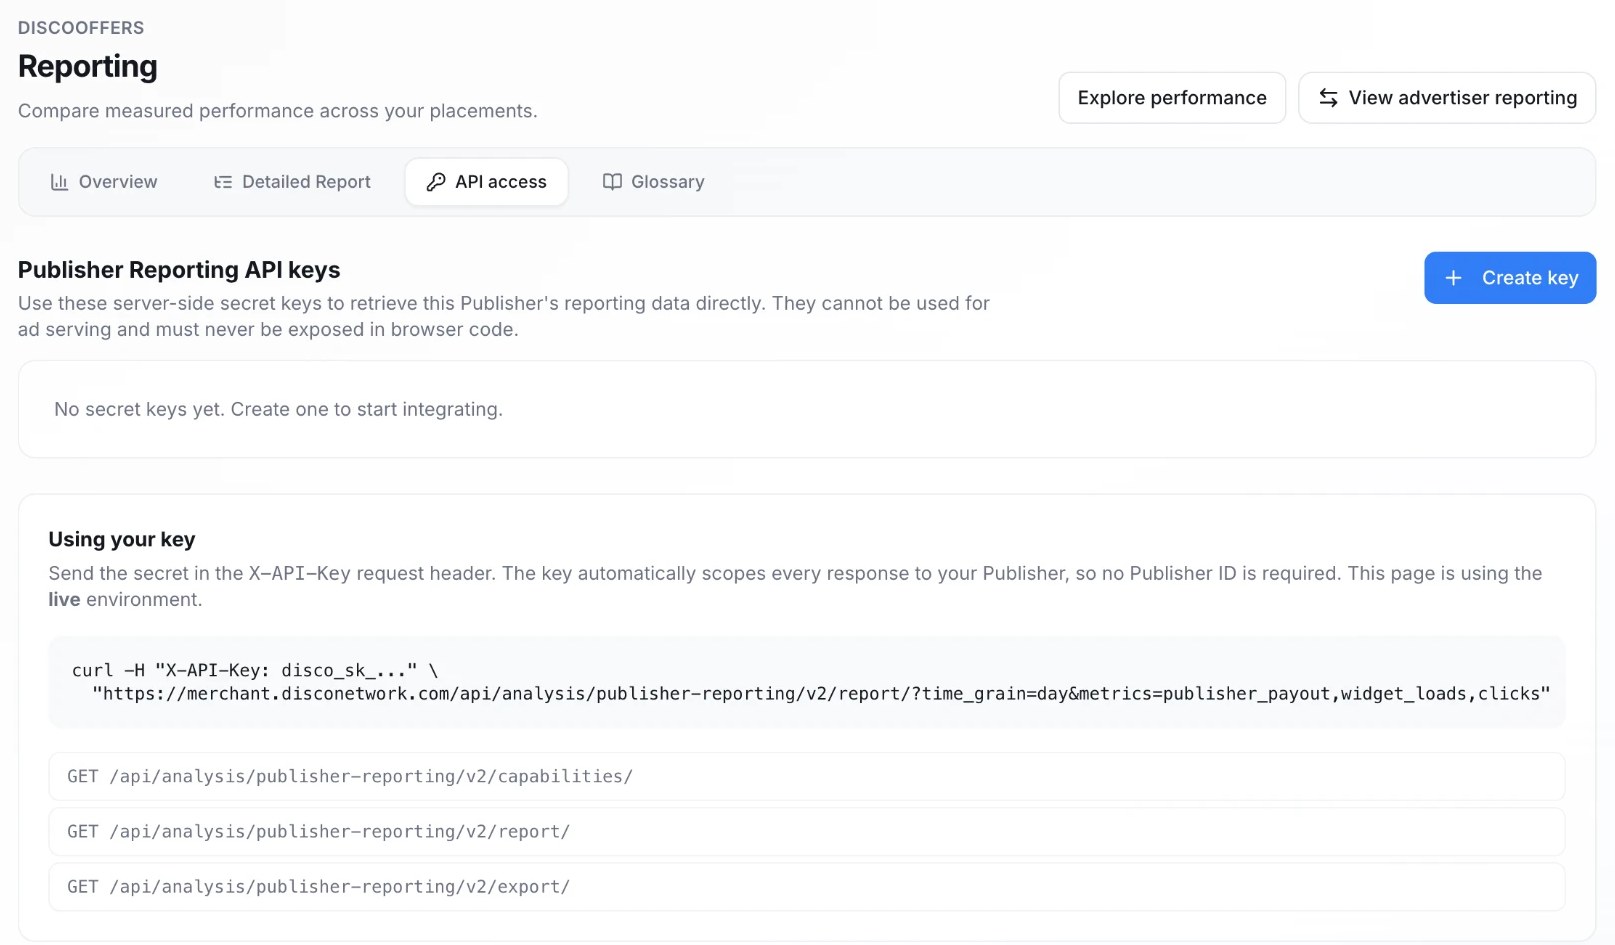
Endpoints, parameters and examples are in the Reporting API guide.
Metrics glossary
- Payout: your earnings as a publisher from the offers shown across your surfaces.
- Widget loads: the number of times an offer widget loaded on your surfaces.
- Widget displays: the number of loaded widgets that were displayed to shoppers.
- Viewable widget displays: widget displays that met the reporting viewability threshold.
- Impressions: the number of times a brand offer was displayed. One widget can show more than one offer, so impressions are usually higher than widget displays.
- Clicks: the number of times shoppers clicked an offer in your widget.
- CTR: click-through rate, offer clicks divided by widget displays (DFLs).
- Conversions: completed purchases attributed to offers shown on your surfaces.
- CVR: conversion rate, conversions as a share of widget displays (Conversions ÷ Widget displays).
- RPL: revenue per load, your average earnings each time a widget loads (Payout ÷ Widget loads). For Pre-Purchase, RPL is your earnings for each purchase that was shown the offer.
- Page type: a placement where your offer widget appears, such as a Thank You page, Order Status page, or email.
Need a view you can't build here? Talk to your CSM or submit a help request.
Payouts
You're never charged anything. Disco pays you. Payouts go out by ACH on the schedule in your agreement (quarterly unless you've arranged otherwise with your Disco team). During onboarding you'll complete an ACH form with your bank details, and your Disco team passes it to our finance team to set up payment.